Analytics: Metrics & Insights
The process of how to use Redash is well documented in official docs. Some of the basic steps for working with Redash are:
-
Add Data sources You can connect with about 30+ supported data sources mentioned in docs from the browser itself.

-
Write Queries Once data is connected we can write queries. It’s always ideal to create individual queries for the necessary visualizations. Writing queries is a data preparation step to process data for visualization.

-
Create Visualizations There are a variety of visualizations supported in Redash. Ten different categories of visualization can be created with just drag and select features to visualize from the queried data. Redash supports visualization types like BoxPlot, Counter, BarCharts, Charts, Sunburst, Sankey, Word clouds, line charts and Area charts. To learn how to create visualizations checkout Redash visualization docs/.

-
Create Dashboards You can create interactive dashboards that can be shared with colleagues easily. The queries can be refreshed periodically as more data comes in.
-
Share Dashboad for public access Share the Dashboard and enable
Allow public accessif you wish to share the dashboard outside of formsflow.ai solution.
Adding Dashboards on Admin Page
To enable dashboards, and provide authorization the following changes are required in existing installations:
-
Create a new main group called formsflow-analytics, and create as many subgroups as you want to associate various dashboards from Admin UI (in Designer)
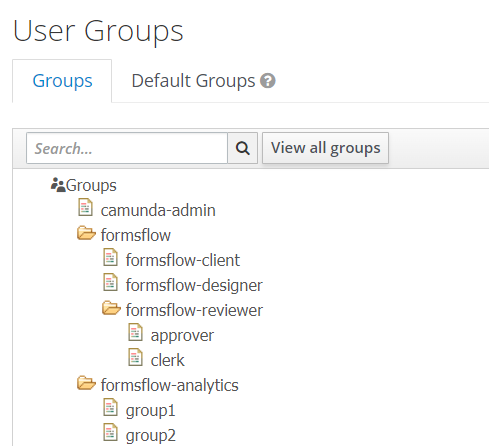
-
Create a new mapper under forms-flow-web client in Keycloak by following the steps below:
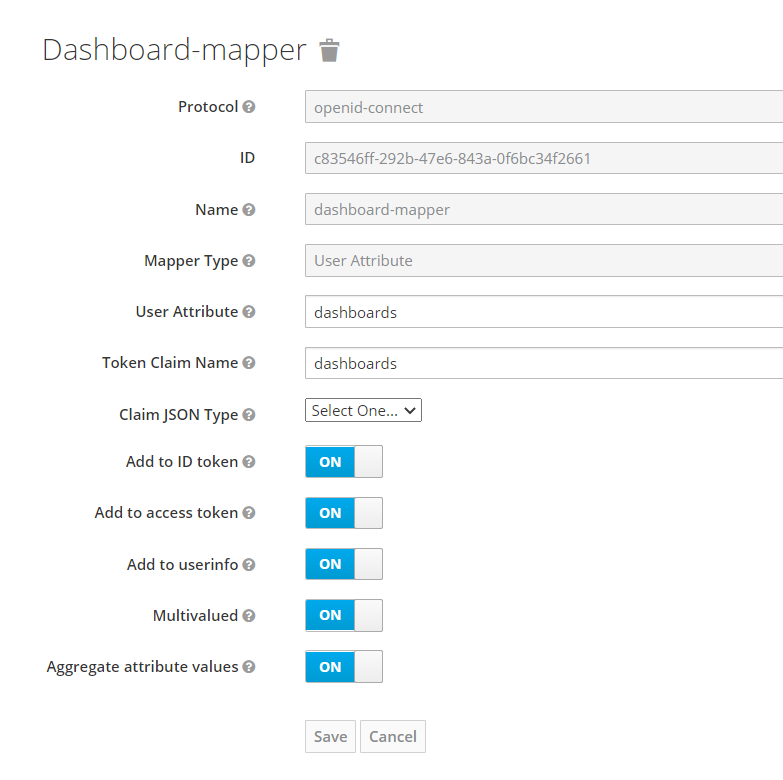
-
Corresponding to each user, add the dashboard-groups you want to enable for dashboard authorization. Any user in a group given permission by the Admin to view a dashboard will then have access to that dashboard.
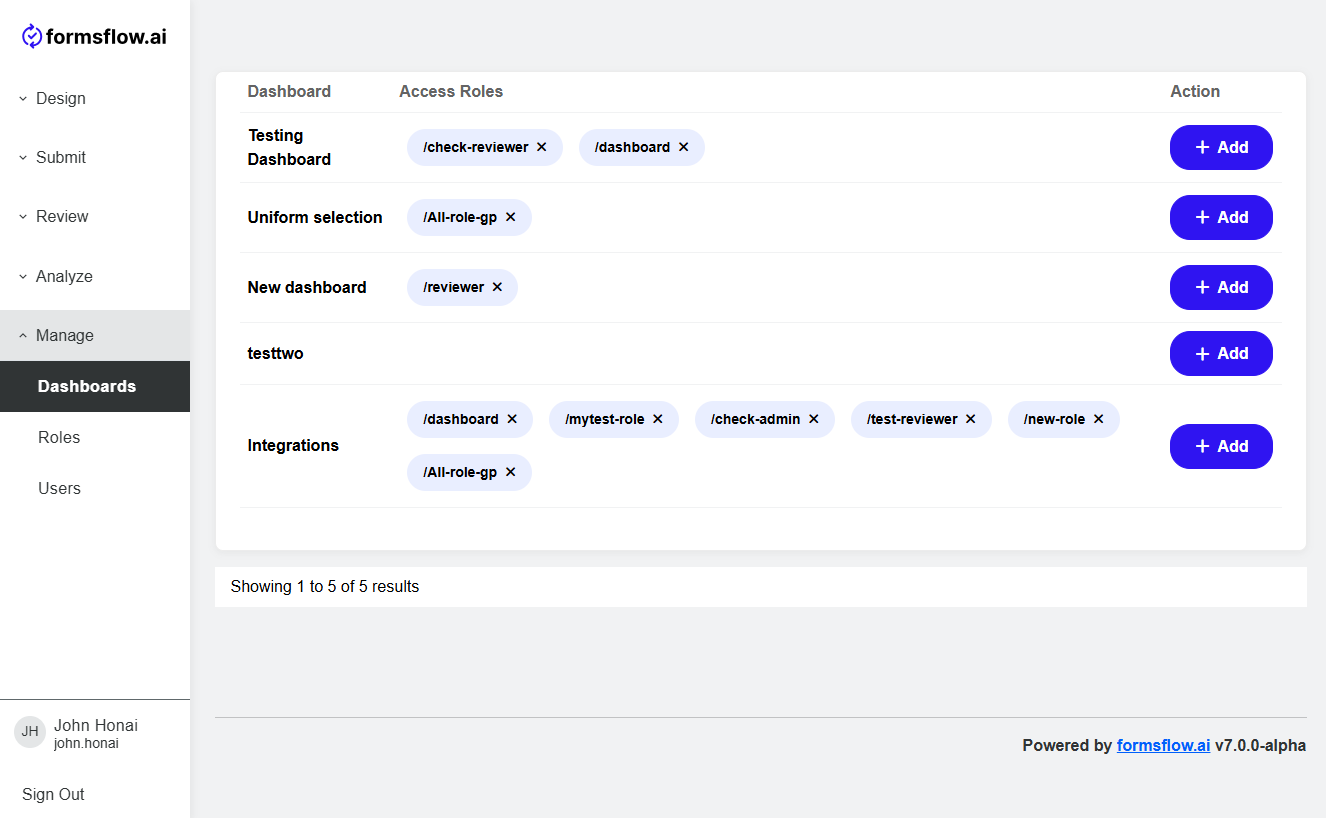
-
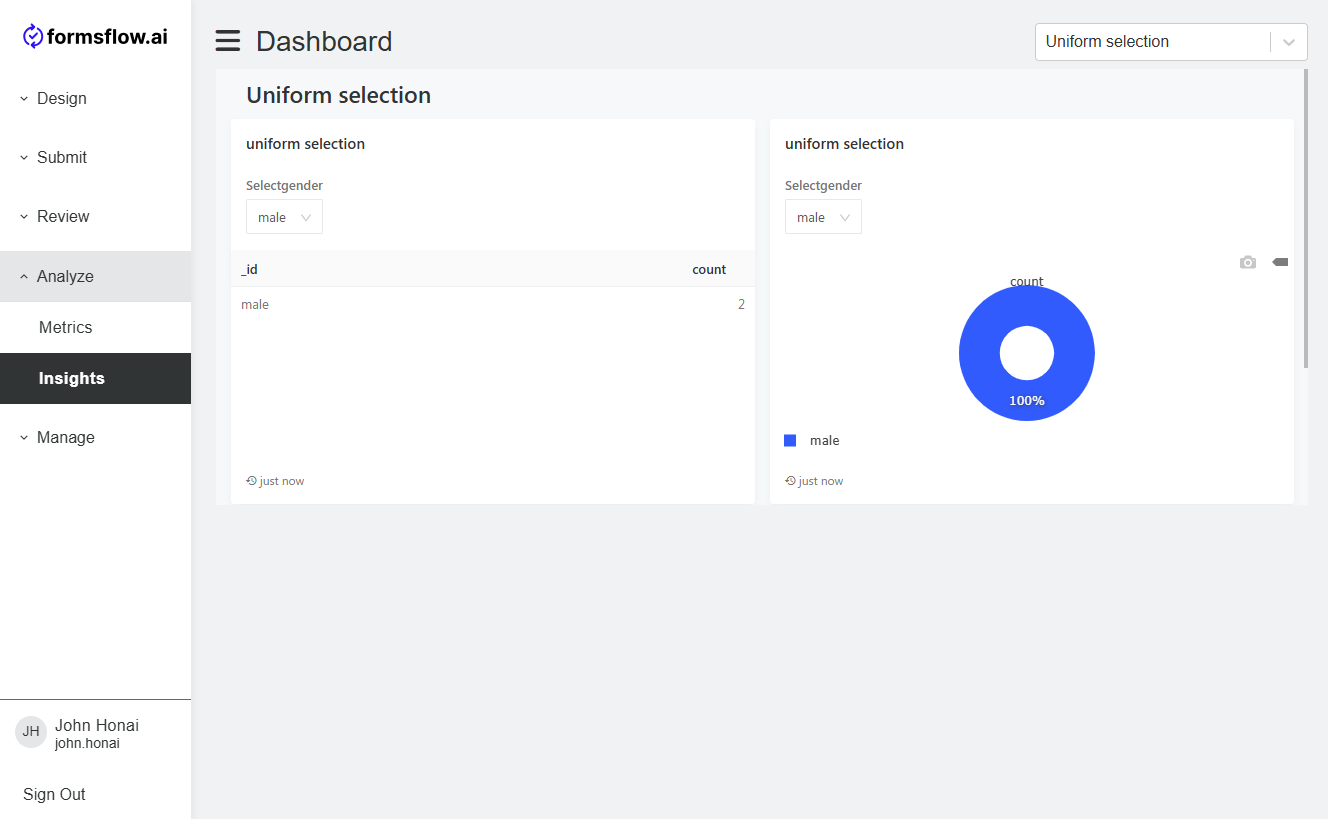
The dashboards added in the above step will be displayed in the Insights tab
Note: Users who don’t belong to any group added in Keycloak will not see an Insights tab option.